Scoring Gene Set Scoring
Introduction
TIP
The Scoring module is a flexible and efficient gene set scoring tool that integrates multiple mainstream scoring algorithms (such as AUCell, UCell, singscore, etc.). It helps researchers quickly assess the overall expression activity of a gene set across all cells, making it an excellent tool for exploring and validating specific biological functions (especially immune-related functions).
In single-cell research, we often need to answer questions like:
- In which cell populations is a pathway of interest (such as "apoptosis" or "interferon response") more active?
- Is a set of marker genes found to be highly expressed overall in a specific cell subpopulation?
- How does the function of "Epithelial-Mesenchymal Transition (EMT)" in tumor cells change in the treatment group compared to the control group?
Gene Set Scoring analysis is designed to address such questions. It integrates the expression information of individual genes into pathway activity scores, allowing for a higher functional-level understanding of cell states and heterogeneity. The Scoring module includes extensive gene set databases related to immunology and cancer, along with rich visualization features, enabling researchers to perform exploratory functional analyses conveniently and efficiently.
Theoretical Basis of Scoring Gene Set Scoring
Core Principles
The Scoring module integrates multiple algorithms, and users can choose any one for analysis:
- AUCell: Uses the Area Under the Curve (AUC) to calculate whether key subsets of the input gene set are enriched at the top of each cell's expression profile. Since this method is based on gene ranking, it is not affected by gene expression units or standardization methods.
- UCell: Similar to AUCell, this is also a ranking-based algorithm that uses the Mann-Whitney U statistic. It has fast calculation speed and robust results.
- singscore: Also based on gene expression ranking but employs a different calculation approach.
- AddModuleScore: A classic scoring method built into the Seurat package that scores by calculating the average expression level of genes within the gene set (after subtracting the expression of randomly selected background genes).
During analysis, the Scoring module uses the selected algorithm to calculate a score for each cell on the specified gene set, ultimately generating a "functional activity matrix" (gene set × cell) for subsequent visualization and statistical analysis.
SeekSoul™ Online Operation Guide
Preparation Before Analysis
TIP
The value of gene set scoring analysis lies in transforming high-dimensional gene expression data into more interpretable functional activity information. Before starting the analysis, please ensure:
- Data preprocessing is complete: Your single-cell data has undergone standard quality control, dimensionality reduction, clustering, and cell type annotation.
- Appropriate gene sets are selected: The quality of gene sets directly determines the reliability of analysis results. You can choose from classic pathway databases built into the platform (such as Hallmark, KEGG, GO), or upload custom gene lists according to research needs.
- Biological questions are clear: What questions do you want to answer through scoring? Are you comparing functional differences between cell types, or observing changes in a pathway before and after treatment? Clear questions will guide you to better interpret the results.
Parameter Details
The following table details the main parameters and their explanations for the SeekSoul™ Online Scoring analysis module.
| Interface Parameter | Description |
|---|---|
| Task Name | The name of this analysis task, must start with an English letter, and can include English letters, numbers, underscores, and Chinese characters. |
| Group.by | Select the label corresponding to the cell type or cluster to be analyzed. For example, celltype. |
| Cell Type | Multiple selection, choose the specific cell types or clusters to include in the analysis. |
| Species | Supports human, mouse, etc. When "user-defined" is selected, custom gene sets can be uploaded. |
| Custom Gene Sets | When Species is set to "user-defined", click [Download Template] and upload a custom gene set (.gmt format) according to the template. |
| Method | Choose the gene set scoring algorithm, including AUCell, UCell, singscore, or AddModuleScore. |
| Split.by | (Optional) Select a categorical label in meta.data to split the graph into different subgraphs by this label, facilitating comparisons between groups. |
| DimPlot | Use umap or tsne plots to display scoring results. |
| Note | Custom remark information. |
Operation Workflow
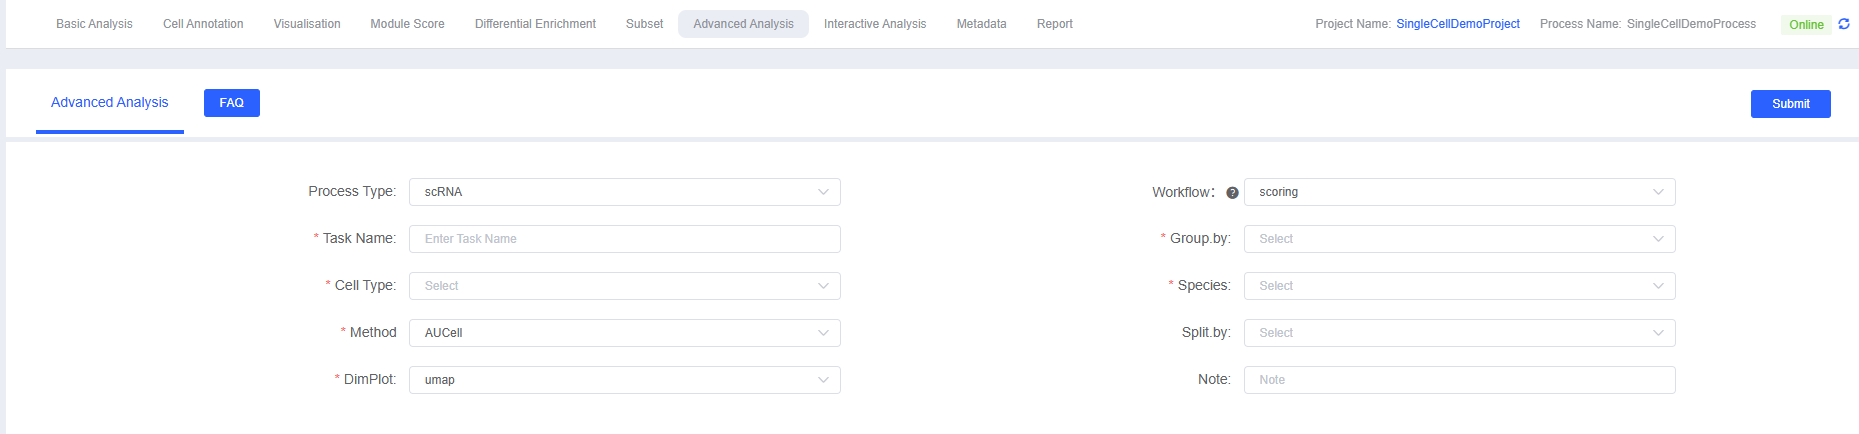
- Access the Analysis Module: In SeekSoul™ Online, navigate to the "Advanced Analysis" module and select "scoring".
- Create a New Task: Name your analysis task and select the sample or project to analyze.
- Configure Parameters: According to the above guidelines, select the algorithm, gene set, cell populations to analyze, etc.
- Submit the Task: After confirming parameters are correct, click the "Submit" button and wait for the analysis to complete.
- Download and View: After the analysis is complete, download and view the generated analysis report and result files from the task list.
Result Interpretation
The Scoring module provides rich visualization results to help you interpret pathway activity from different dimensions.
AUCell Score Dimensionality Reduction Plot for Each Gene Set Across Different Cell Populations
This is one of the most intuitive results. It maps the scores of specific gene sets onto UMAP/tSNE dimensionality reduction plots, visually displaying the enrichment of this function across different cell populations.
- Left Figure: Colored by cell population, used to locate different cell types.
- Right Figure: Colored by gene set score, darker colors indicate stronger activity of the pathway/function.
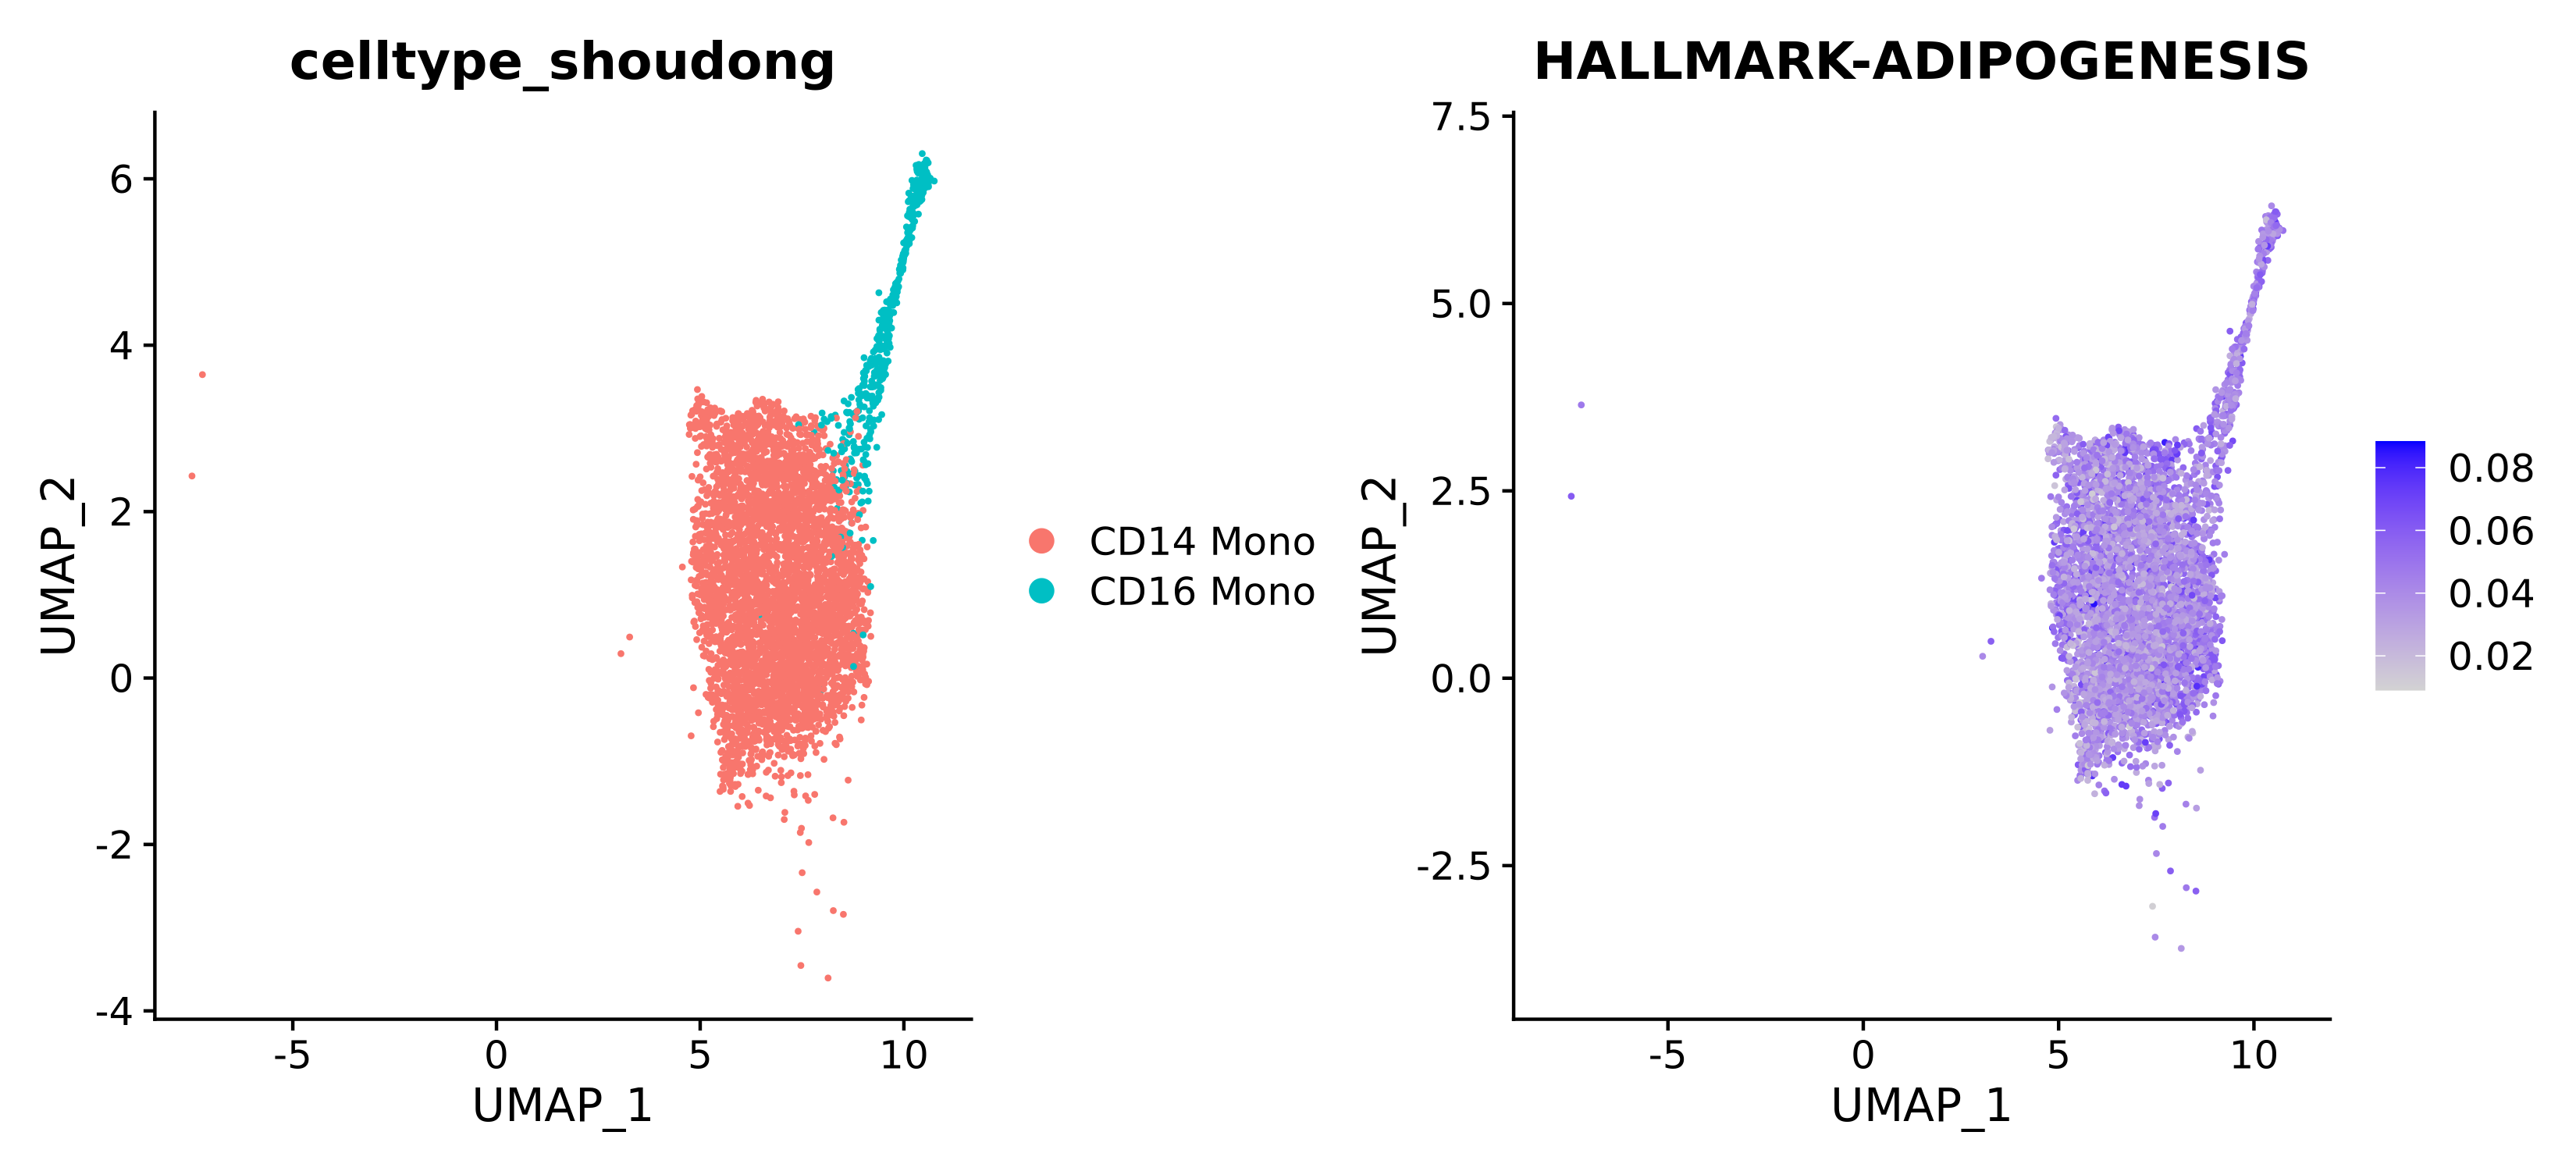
| Annotation | In the left figure, different colors represent different cell populations; in the right figure, darker colors represent higher scores, and lighter colors represent lower scores. |
|---|
AUCell Score Violin Box Plot for Each Gene Set Across Different Cell Populations
Used to precisely compare the score distributions of different cell populations on this gene set. Violin plots show the density distribution of scores, while box plots display statistical information such as median and quartiles, facilitating statistical testing of differences between groups.
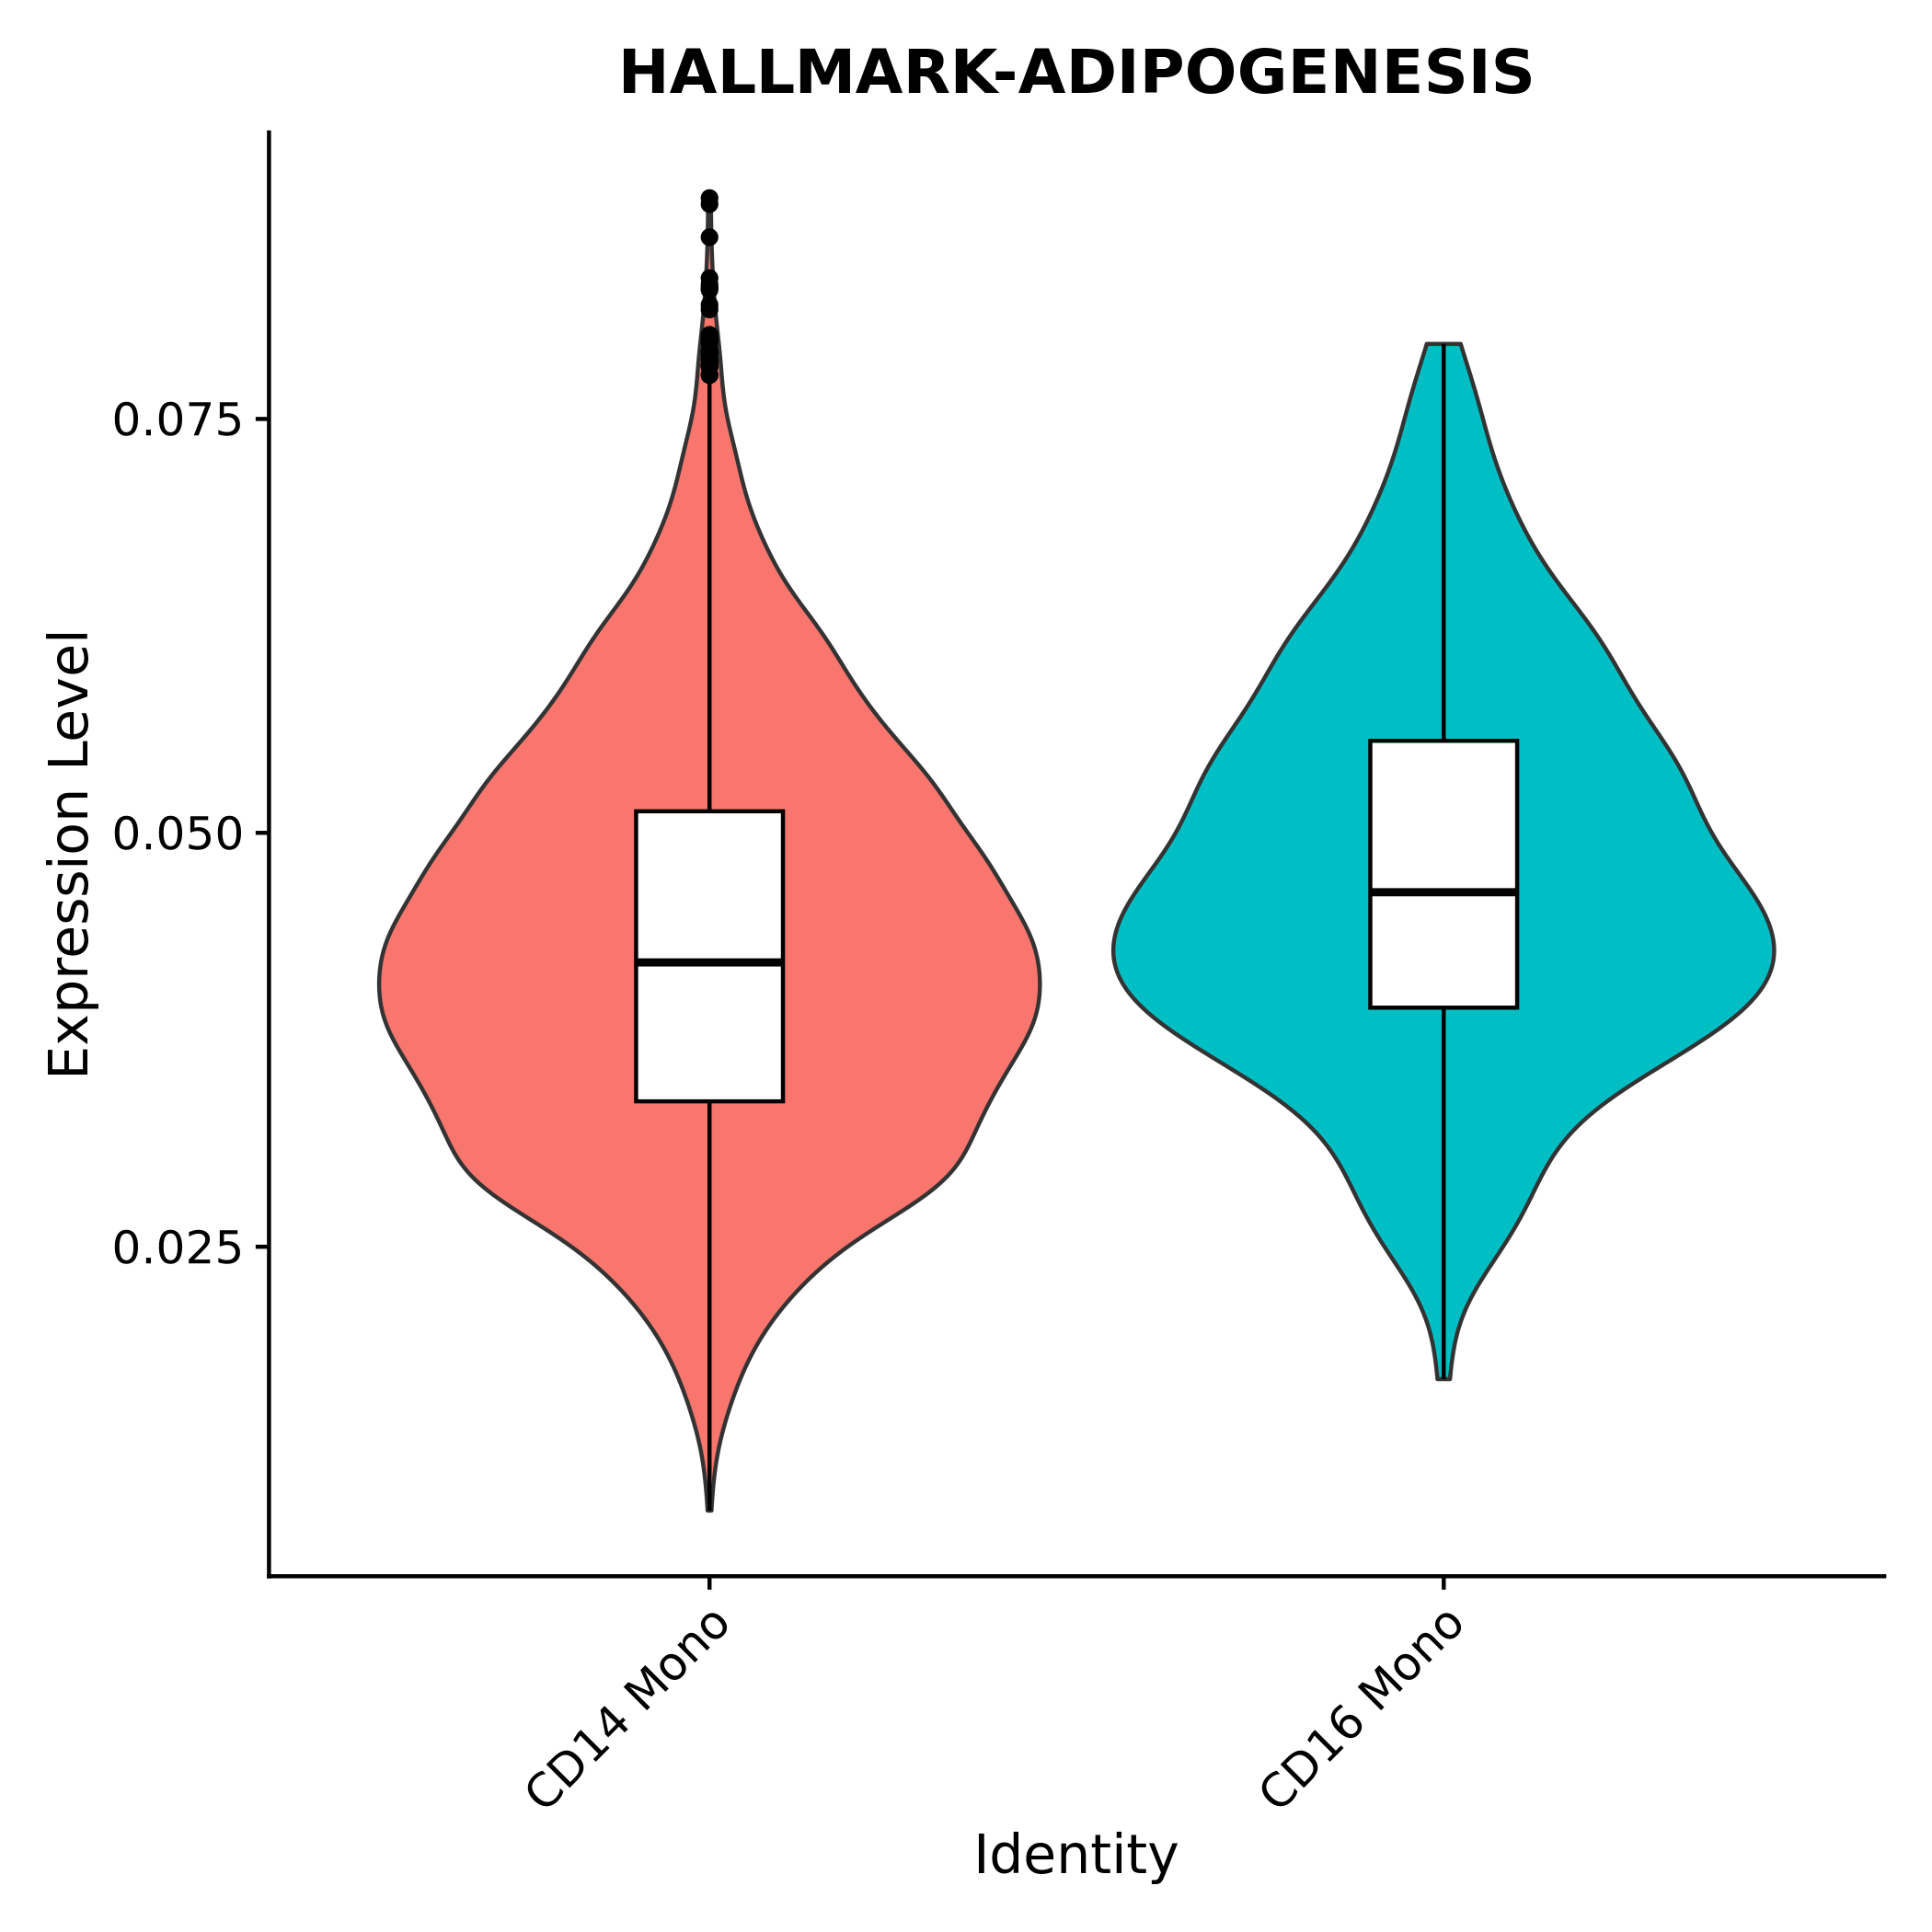
| Annotation | Score information is displayed using both violin and box plots, with different colors representing different cell populations. |
|---|
Result File List
| File Name | Content Description |
|---|---|
*.csv | Core Data: Result data table file recording the scores of each cell on each gene set. |
*_dim.png/pdf | Dimensionality reduction plots of scores for each gene set across different cell populations. |
*_vln.png/pdf | Violin box plots of scores for each gene set across different cell populations. |
split/ | If Split.by is set, various visualization results split by group or sample will be stored in this directory. |
Application Case
Case: Revealing the Multiple Roles of ALDH Family in Glioma
- Literature: Wang Z, et al. Front Immunol. 2022.
- Background: Aldehyde dehydrogenase (ALDH) family is thought to play important roles in various cancers, but its specific functions in glioma remain unclear.
- Analysis Strategy: Researchers used single-cell data to evaluate the functions of the ALDH family by calculating AUCell scores for three GO pathways related to cell proliferation, migration, and immunity.
- Key Findings:
- Functional Activity Assessment: Through AUCell scoring, they found that tumor cells with high ALDH expression scored significantly higher on pathways related to "cell proliferation", "cell migration", and "immune response".
- Conclusion: This study cleverly used gene set scoring to connect complex gene expression with specific biological functions, confirming that the ALDH family may influence glioma progression by regulating tumor cell proliferation, migration, and immune landscape, providing strong evidence for subsequent functional verification.
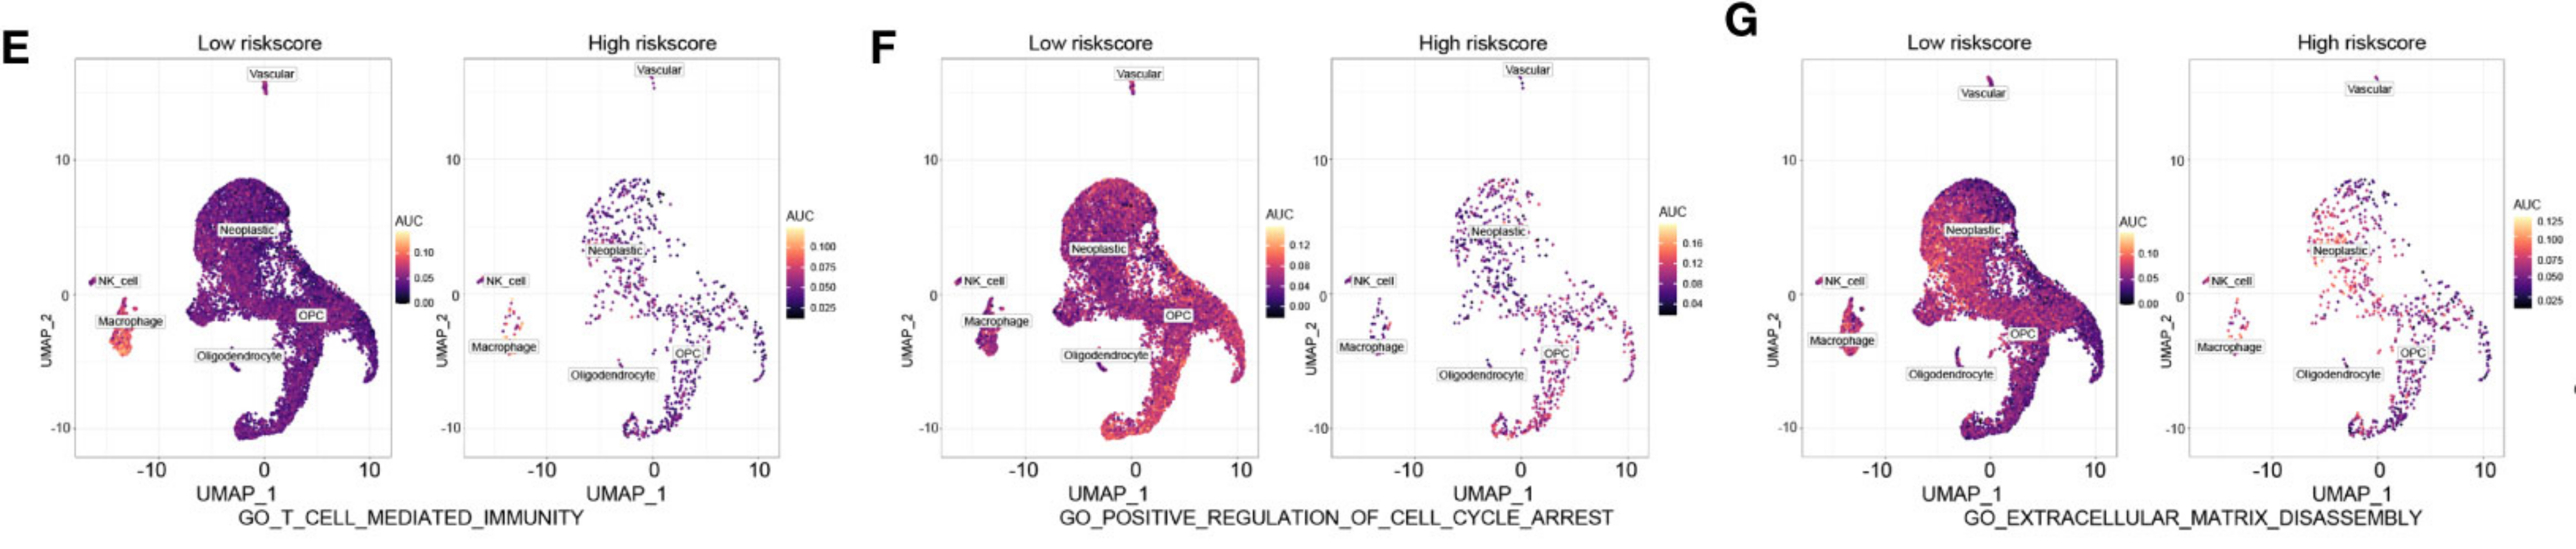
(Figure caption: Using AUCell scores to assess ALDH family functional activity in glioma.)
Notes
1. Algorithm Selection: Different scoring algorithms have their own advantages and disadvantages. AUCell and UCell are currently the recommended ranking-based methods, as they have lower dependency on data standardization. AddModuleScore is more intuitive but may be more affected by highly expressed genes.
2. Gene Set Selection: The biological significance of results entirely depends on the gene sets you choose. Please use gene sets from authoritative databases (such as MSigDB, KEGG) or those reported in literature that have been validated. For custom gene sets, sufficient biological rationale is needed.
3. Scores are Relative Values: Gene set scores are relative values used to compare activity levels between different cells or cell populations; their absolute values have limited significance on their own.
Frequently Asked Questions (FAQ)
Q1: What are the differences between Scoring, GSVA, and scMetabolism?
A: All three are tools for gene set enrichment or scoring, but with different emphases:
- Scoring: The core is single-cell gene set scoring. It calculates a pathway activity score for each cell, excelling at showing the heterogeneous distribution of pathway activity across different cells. It integrates multiple scoring algorithms and is particularly suitable for exploratory analysis and immune-related functional research.
- GSVA: The core is sample/cell population-level gene set variation analysis. It converts gene expression matrices into gene set enrichment score matrices, often used to find pathways with significant differences between cell populations, suitable for differential pathway analysis.
- scMetabolism: Focuses on metabolic pathway scoring and visualization. It includes all metabolic pathways from KEGG and provides multiple metabolism-related visualization methods, making it a specialized tool for studying cellular metabolic heterogeneity.
Q2: How to interpret AUCell scores? What do high or low scores represent?
A: AUCell scores reflect the enrichment degree of a gene set in the gene expression ranking list of a single cell.
- High score: Means most genes in the gene set have relatively high expression levels in this cell (ranked at the top), indicating that the biological function represented by the gene set may be more active in this cell.
- Low score: Means genes in the gene set have relatively low expression levels in this cell, indicating that the function may be inactive. What matters is comparing relative magnitudes, not absolute values. For example, you can compare the "proliferation" pathway scores of tumor cells and normal cells to determine which population proliferates more actively.
Q3: Can I upload my own gene list for analysis?
A: Yes. You need to organize your gene list into a .gmt format file. A .gmt file is a tab-delimited text file, where each line represents a gene set in the following format: GeneSetName Description Gene1 Gene2 Gene3 ...
- The first column is the gene set name.
- The second column is the gene set description (can be left blank).
- Starting from the third column are all gene IDs included in the gene set (must match the gene ID type in your data, such as Symbol). During operation on SeekSoul™ Online, set the
Speciesparameter to "user-defined", then upload your .gmt file.
References
- Aibar S, et al. SCENIC: single-cell regulatory network inference and clustering. Nat Methods. 2017 Nov;14(11):1083-1086.
- Wang Z, et al. The ALDH Family Contributes to Immunocyte Infiltration, Proliferation and Epithelial-Mesenchymal Transformation in Glioma. Front Immunol. 2022 Jan 7;12:756606.
- Fan C, et al. irGSEA: the integration of single-cell rank-based gene set enrichment analysis. Brief Bioinform. 2024 May 23;25(4):bbae243.